

4. EXPERIMENTAL PROCEDURE
4.5. Practice 3: Absorption of carbon dioxide in a column filler
Introduction
The aim of this practice is to determine how much carbon dioxide is capable of absorbing the pilot plant from a gas stream where there will be a mixture of CO2 and air through a liquid extractor in this case is the water.
In order to determine the amount of carbon dioxide absorbed by the water, need to know how much CO2 in water at the exit of the column. For this reason is performed an material balance.
To make a material balance :
These balances will be used to determine the amount of carbon dioxide absorbed by the water column. The steps are:
1) Scheme.

Figure 7.5: Scheme of the absorption.
Where:
X1: Molar fraction of CO2 out of the liquid.
X0: Molar fraction of CO2 at the entrance of the liquid (that is considered is zero).
Y1: Molar fraction of CO2 in the exit gas.
Y0: Molar fraction of CO2 in the gas entry.
2) It is necessary to know the pressure losses that occur in the flow of water, working with different air flow, with units of atmospheres.
![]()
We must take into account the relative total pressure at which they are working all the time, this pressure is marked by Bourdon type manometer. This makes the device reads the bar units, therefore need a change in atmosphere units.
![]()
Given that the pressure that marks the manometers is the relative pressure, must be expressed as the absolute pressure. To do this you must watch the atmospheric pressure inside the laboratory, using a barometer and make the change of units of millimeters of mercury (mmHg) atmospheres (atm).
![]()
Therefore:
![]()
The absolute pressure can be considered pressure input to the column and will be called P1, since this pressure on the team is measured in the junction of carbon dioxide in air.
So we can say:
![]()
Since the value of dp is known and also the value of P1, then you can get the value of P2.
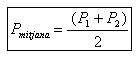
Finally you can get the values of the average pressure:
3) Find the density of carbon dioxide.
To find the density, we must be considered the mean pressure found previously with temperature what we are working within the column. With these two parameters and table 7.6 may be an interpolation to find the density of CO2.
Table 7.6: Density of CO2 (kg/m3) depending on pressure and temperature.
Source: Manual dexperiments de la planta pilot
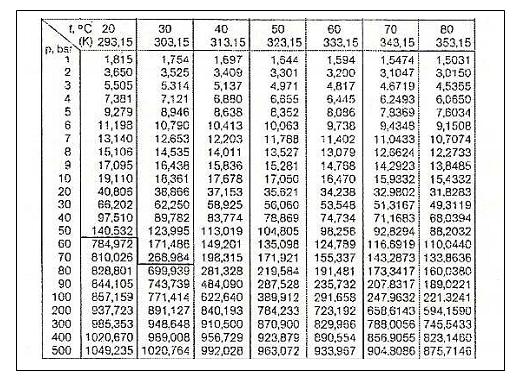
Please note the units of the table, which are in degrees Celsius for temperature and bars for pressure. Interpolating obtained the value of ρCO2 in kg/m3.
4) Find the density of water.
To find the density of water must consult table 7.7, we have to know what temperature is working directly with the ρ water and units are g/ml. Fill out change of units kg/m3.
Table 7.7:Density of water depending on temperature.
Source: CRC, Handbook of chemistry and physics.

5) Find the density of air.
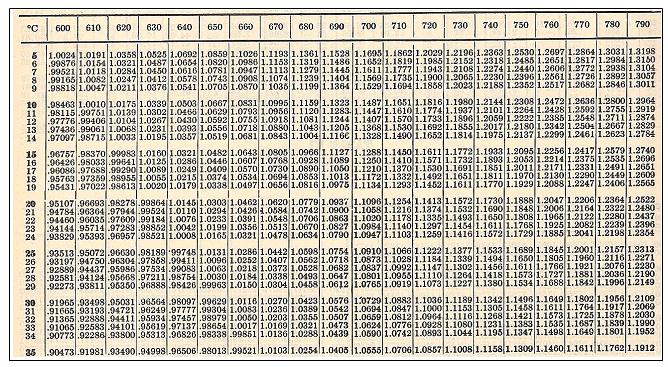
The air density is found using table 7.8. which depends on pressure and temperature, so that interpolation is obtained using a value ρair, in units of kg/m3 .
Table 7.8: Density for air (kg/m3) depending on pressure and temperature.
Source: CRC, Handbook of chemistry and physics.
6) Molar mass for each component.
You must calculate what is the molar mass of each component:
MMCO2 , MMair and MMwater.
7) Conversion of volumetric flow at all flow molars to facilitate the subsequent calculations.
To perform the conversion of the flows needed the density and molar mass of each component previously found.
And calculate the total gas flow at the entrance of the column (kmol/min).
![]()
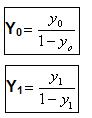
8) Molar ratios at the entrance and exit of the column.
Since the beginning of the experiment was determined with the measuring device Oxybaby, what is the initial amount of carbon dioxide on entrance to the column and subsequently measured the amount has been absorbed, you can find the molar ratios of input and output column.
10) Molar flow that passes from the gas phase to liquid phase.
With the values of molar volume and molar ratios of the input of gas is obtained the molar flow which passes from the gas phase to liquid phase (kmol/min).
![]()
Where:
y0: Mole fraction of CO2 the entry (moles CO2/total moles).
y1: Mole fraction of CO2 exit (moles CO2/total moles).
11) Flow of carbon dioxide output.
With all the previous data of flow of air, carbon dioxide and the molar flow that passes from the gas phase to the liquid phase we can calculate the amount of flow out of CO2 (kmol/min).
![]()
12) Liquid flow at the exit.
![]()
13) Ratio of liquid carbon dioxide in the exit (kmol CO2/kmol H2O).

14) Mole fraction of gas in the water at the exit (kmoles de CO2/total kmoles):

Material
- Pilot plant absorption of gases.
- Oxybaby.
- Bottle of carbon dioxide.
Procedure
- Start the device by opening the main switch (2) (make sure that the emergency switch (1) is not actuated).
- Close the valve adjustment for level of ability in column (3).
- Open the valve completely by adjusting the air flow (8) and the pressure adjustment valve (11).
- Connect the pump pumping water column from double pushbutton (5) and adjust the water flow to 100 l/h.
- Put into operation in dual pushbutton compressor (4) and adjust the air flow with the valve adjustment of airflow (16), 30 l/min.
- Connect the canister of carbon dioxide, and regulate the flow of CO2 with the valve adjustment (7).
- Adjust the level of the column with the valve adjustment of the level of the column (3), so the level is kept constant, the level marked.

Figure 4.27: Distribution box and valve adjustment of the level of the column.
1 - Emergency switch.
2 - Main switch.
3 - Valve Adjustment level capacity of the column.
4 - Double pushbutton compressor.
5 - Double pushbutton pump 1.

Figure 4.28: Optimal level of the column.

Figure 4.29:Valve opening and closing of the cylinder of CO2 .
- Initially set the flow of water to 100 l/h with the water valve adjustment (8).
- Then we need to regulate the airflow at 30 l/min, the air valve adjustment (15).
- For the first experiment was to regulate the flow of carbon dioxide with the regulating valve (6) at 4 l/min and the second experiment should regulate it at 5 l/min.
- After setting these parameters is necessary to maintain a constant background level of the column. To regulate it can be done from the level of the valve column (3) or the control valve pressure column (10).
- In order to stabilize the device must wait about 10 minutes before doing any reading.
- Once stabilized, initially to perform a reading of pressure tubular gauges and noted the pressure difference. Then perform measurements of the concentration of carbon dioxide with Oxybaby, three measuring points.
- Increase air flow 10 l/min increasing to a flow of 60 l/min air, and do the same procedure, performed the first reading of the pressure loss and then measures the Oxybaby .
- Carry out the same experiment by increasing the water flow to 150 l/h.
- All experiments were performed in triplicate.
- Once the practice finished, close the valve supplying carbon dioxide from the cylinder.
- Disconnect the pump with a double push button (5). I hope that down the entire water column.
- Disconnect the compressor with double push button (4).
- Disconnect all main switch of the installation (2).
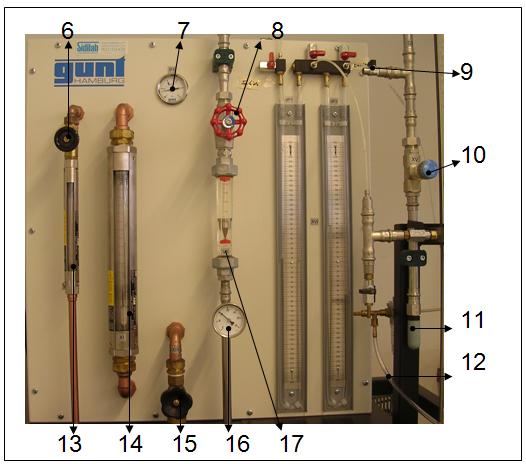
Figure 4.30: Panel elements.
6- Valve adjustment of CO2.
7- Bourdon type manometer.
8- Valve adjustment of water.
9- Sampling point 3.
10- Valve adjustment pressure in the column.
11- Muffler, exhaust air.
12- Rubber hose to the second reading of the sampling point.
13- Carbon dioxide flow meter.
14- Air flow meter.
15- Air valve adjustment.
16- Thermometer water.
17- Flowmeter water.
Below is the video of how to practice:
Questions
1) What is the technique of separation of industrial gas absorption?
2) What is a column of plates? And a filling? What is the difference between one and another?
3) Why would serves a flow meter? And a manometer?
4) What is the solubility of CO2 in water ?
5) Fill the following table from the absorption obtained in different experiments
Table 7.9:Example table of experimental results.
Lwater |
Gair (l/min) |
GCO2 (l/min) |
dp1 |
dp2 |
Plaboratory |
Prelative (bars) |
POINT 1 (%CO2) |
POINT 2 (%CO2) |
POINT 3 (%CO2) |
|
|
|
|
|
|
|
|
|
|
|
|
|
|
|
|
|
|
|
|
6) Plots the different values obtained. In the first graph should represent the effect of water at different air flows (Y-axis, the percentage of CO2, and X-axis, water flows, keeping constant the air flow) and the second graph should represent the effect of air at different water flows (Y-axis, the percentage of CO2, and X-axis airflow, keeping constant the flow of water).
7)Discuss the results. What are the best working conditions for the column?
8) Performs the material balances the value for each value obtained and calculating the carbon dioxide content of water outside column.